| |||
Visualization Support ExamplesThere are 4 examples of CSAR visualization projects given here:
Example 1: Professor Smith (Dr Margetts) - Department of Engineering, University of ManchesterDr Lee Margetts has been studying geomechanics and producing a library of parallel engineering FEA codes. Lee was nearing the end of his project but was having difficulty validating his results. He was using a visualization system that was not interactive and did not show him the features in his data that interested him. The visualization system he was using had been developed by a local member of the research team who had since left. It was becoming apparent that this group of engineers would need an alternative visualization system. A small project was set up with UKHEC to produce a special reader in AVS/Express especially for the engineers' data. The reader was developed and tested on Lee's data and a special application was devloped for him to the important features in his data. He used this application initially on small test data to help him debug the code. In the final part of his research he ran a high resolution code which he could not visualize on his own machine but instead used our specialist graphics hardware to explore his data within a virtual environment.
A report was produced on this work for UKHEC and a paper was given at the CARVI conference. Example 2: Dr H. Davies - University of Liverpool (now at the University of Cardiff)The UK Terra Consortium was led by Dr. Huw Davies. The consortium ran simulations of the circulation of the Earth's mantle (the layer between the crust and core) which used 512 processors of the Cray T3E for up to 12 hours. These results were then compared to seismic tomography images also derived by the group. Initially they could only analyse the results by producing a series of 2D projections, one for each layer of data. All 2D projections are inherently distorted and hence may be misleading. 3D views of the data decrease abiguity and distortion but it is important that they can be interactively cut, isosurfaced and rotated. CSAR developed a number of tools for this purpose. Huw Davies was pleased by the results of this visualization work. He works with researchers in the USA and they too are impressed - they have some 3D visualizations but not on data of this complexity or with this flexibility. The Terra group are keen to use the visualization tools on a permanent basis. The original 2D slices of the Earth's Mantle: 
Final 3D images of the same data
A paper was given on this work at the Cray User Group Example 3: Prof Coveney - Queen Mary, University of London (now at UCL)Visualisation in Parallel - VIPAR. VIPAR was originally a 2 year EPSRC research project in carried out at Manchester Visualisation Centre in 1996/1997 by Steven Larkin. The primary goals of this project were to provide:
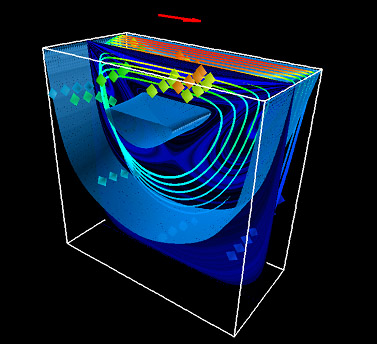
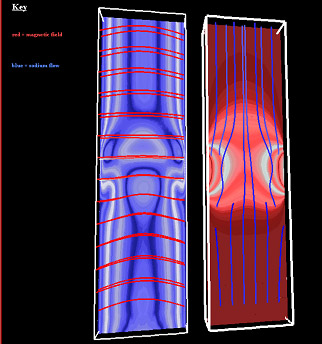
As a result of a request from Professor Coveney, the VIPAR project was re-opened specifically to address some of the requirements of his CSAR Consortium. This includes the development of parallel isosurface and FFT modules, and in the longer term, to help in providing a route for computational steering. This project was initially funded by support tokens. Then while project proposals were being written the work was continued through UKHEC. The Reality Grid project took this work as a start point for their project. A report on this work was produced for UKHEC. Example 4: Lionel Temmerman - Department of Aeronautics, Imperial College LondonLionel Temmerman was nearing the end of his project and ran a high resolution simulation that was too large for him to visualize on his local machine. He wanted some images from the high resolution data for his thesis and for a paper he was writing. The images needed to:
A series of images were created with different greyscale, resolutions and camera angles so that he could embed them in his text and check that the correct information was visible when the page was printed as well as viewed on the screen. Lionel provided much input about the style of images and content throughout the process and opted to have colour versions of the images too.
|
|||
|
Page maintained by csar-advice@cfs.ac.uk This page last updated: |
|||